1 + 1Starting with quarto
quarto
code
website
how to start with quarto for documentation
Intro:
Since the appearance of quarto, perhaps it would be more effective to write all in .qmd files cos of its advantages,
- images can be added easily and automatically
- img captions
- code writing and
- compatible with Zotero bibliography (for word, Rstudio and quarto)
- Almost same code/outcome flexibility as Mkdocs code package.
- Qmd files can be opened in vs code directly and updates instantaneously as I write for color copy/paste code.
- Visual mode is very convenient, as I can copy paste format directly to word (no need to convert/apply format code to word format).
Quarto install or upgrade
Quarto enables you to weave together content and executable code into a finished document. To learn more about Quarto see https://quarto.org .
terminal-brew
brew install --cask quarto
brew upgrade --cask quarto
Note
20230330 upgrade: quarto –version: 1.2.475 (Release Candidate — v1.3.296 available as CLI, but not as brew cask)
Running Code
When you click the Render button a document will be generated that includes both content and the output of embedded code. You can embed code like this:
You can add options to executable code like this
[1] 4The echo: false option disables the printing of code (only output is displayed).
you can write chunk options in the body of a code chunk after #|, e.g.,
for more info see here.
Seattle Precipitation by Day (2012 to 2016)
For ojs and pkp (public knowledge project) install packages first. follow this pkp installation guide.
https://pkp.sfu.ca/software/ojs/download/
data = FileAttachment("../data/seattle-weather.csv")
  .csv({typed: true})

Plot.plot({
  width: 800, height: 500, padding: 0,
  color: { scheme: "blues", type: "sqrt"},
  y: { tickFormat: i => "JFMAMJJASOND"[i] },
  marks: [
    Plot.cell(data, Plot.group({fill: "mean"}, {
      x: d => d.date.getUTCDate(),
      y: d => d.date.getUTCMonth(),
      fill: "precipitation",
      inset: 0.5
    }))
  ]
})
Air Quality
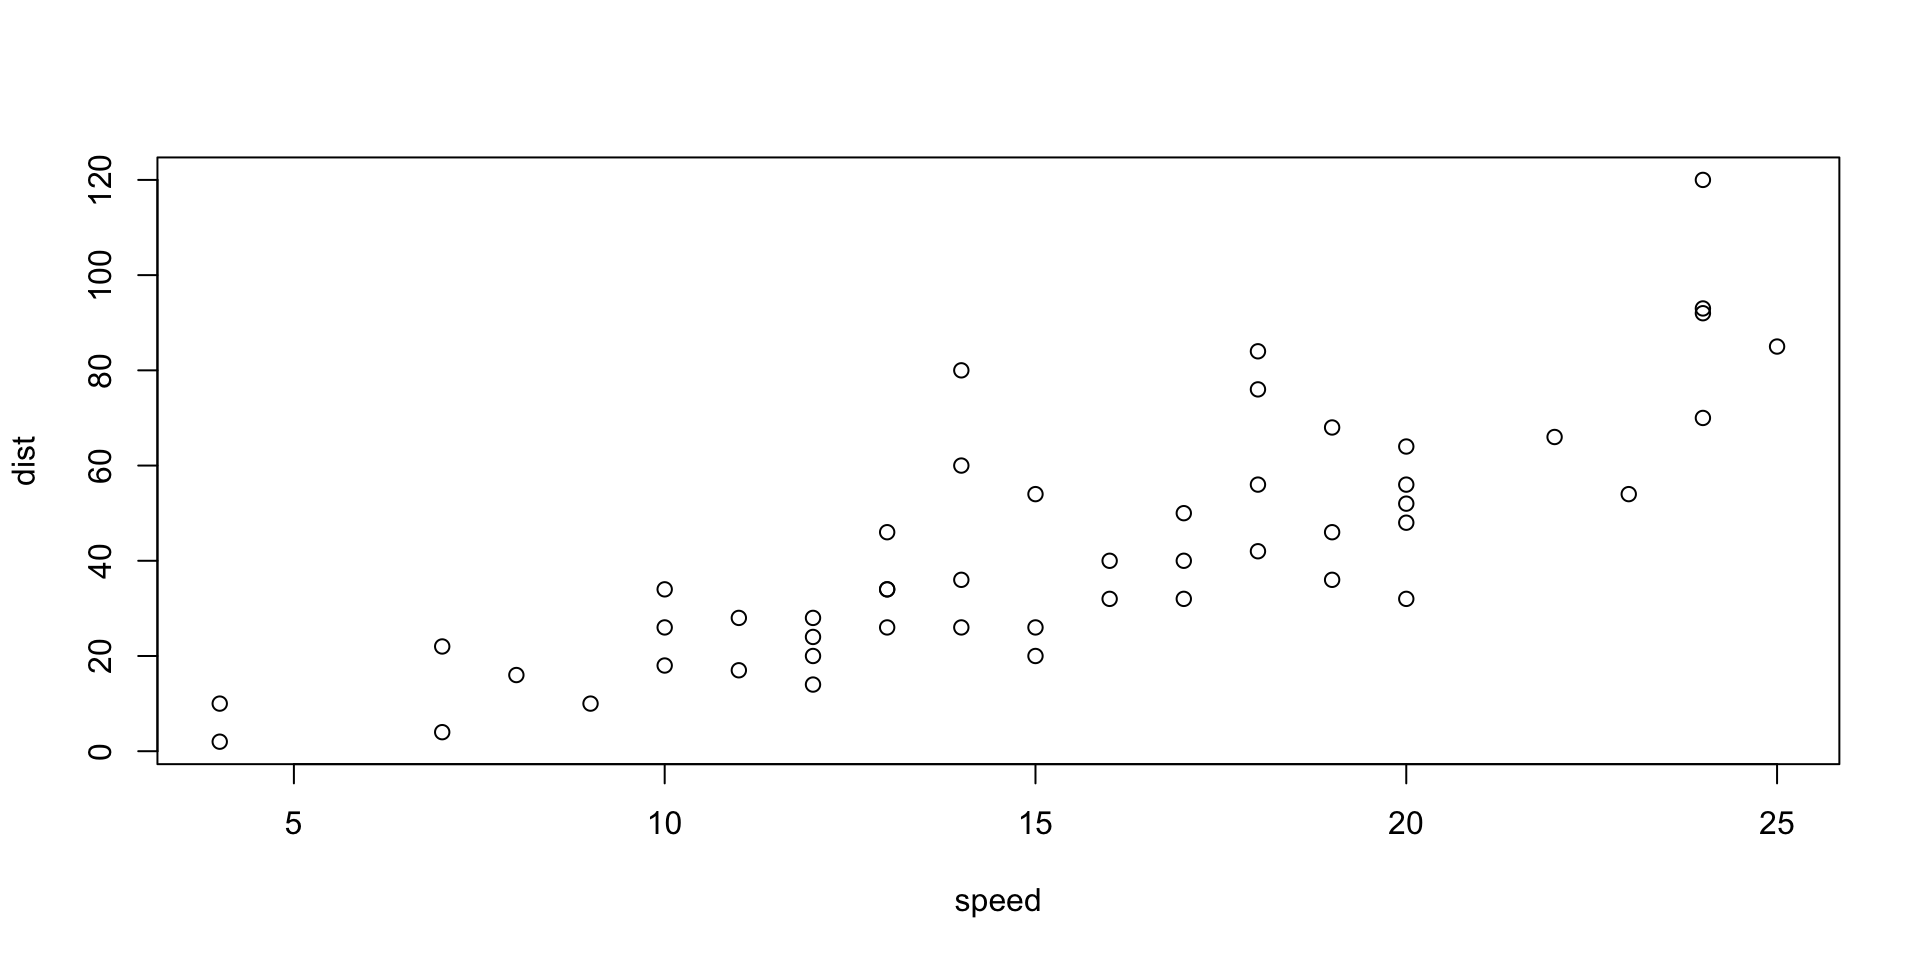
Figure 1 further explores the impact of temperature on ozone level.
library(ggplot2)

ggplot(airquality, aes(Temp, Ozone)) +
  geom_point() +
  geom_smooth(method = "loess"
)
For a demonstration of a line plot on a polar axis, see Figure 2.
Make sure that the console in the r and not in Python. In the top label you will see either the R logo with > or the python logo with >>>, to exit python console press esc and you will go back to the R console.
library(reticulate)# install python see Python
pip3 install numpy
pip3 install matplotlib
python3 -m pip install numpy
python3.11 -m pip install --upgrade pip
pip3.10 install numpy
python3.10 -m pip install --upgrade pip# Pre-intallation required through terminal:
import numpy as np
import matplotlib.pyplot as plt
r = np.arange(0, 2, 0.01)
theta = 2 * np.pi * r
fig, ax = plt.subplots(
subplot_kw = {'projection': 'polar'}
)
ax.plot(theta, r)
ax.set_rticks([0.5, 1, 1.5, 2])
ax.grid(True)
plt.show()
If error: ModuleNotFoundError: No module named ‘numpy’ in Python
See here
Python test.
import numpy as nplibrary(reticulate)Running Code summary
Related to code and code chunks.
In yml sections:
---
format:
  html:
    code-fold: show
    code-copy: true
    code-overflow: wrap
---
In chuncks:
#| eval: false
#| echo: false
#| my-chunk, echo = FALSE, fig.width = 10,
#| label: fig-airquality
#| fig.cap = "This is a long long long long caption."
#| fig-cap: Temperature and ozone level.
#| warning: false
# For python, pre-intallation required through terminal:
# pip install numpy
# pip install matplotlib
import numpy as np
import matplotlib.pyplot as plt

1 + 1